Воскресенье, 21 Января 2024
Прошел урок по сезонности из тайм сириес на кагле. Написал программу которая пытается играть в дудл джамп. Тут можно посмотреть подробности.
Seasonality
В данных бывает переодичность. Что то происходит по кругу, раз в год, раз в четыре месяца, раз в месяц, раз в неделю и тд. Это называется сизональностью или скореф на русском переодичностью
Как можно рассмотреть сезональность
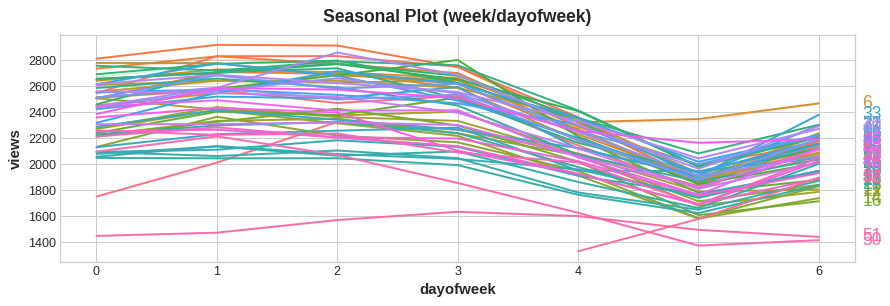
Сделать график, где будут все периодические линии начинаться с начала графика, например разбить график на недели и наложить эти графики на один

Добавить показатель сезонности
Это как категорикал переменные, преобразованные с помощью ван хот енкодинга. Если сегодня суббота, то в колонках не субботы будут стоять 0, а на субботе 1
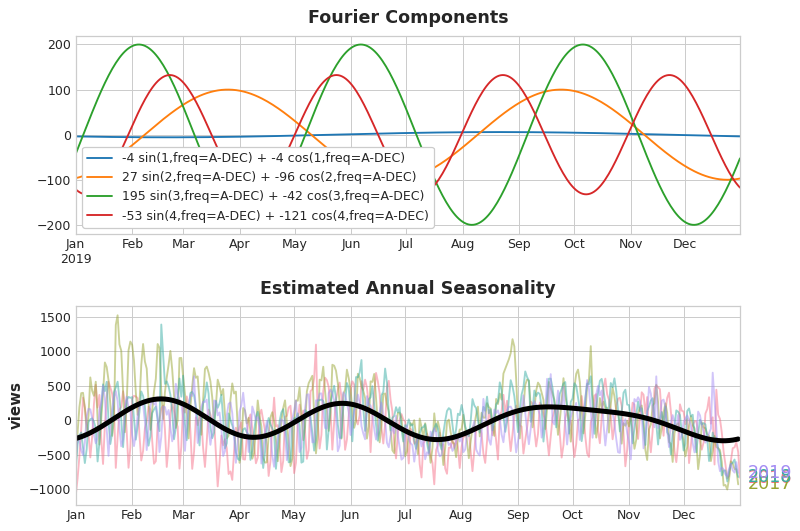
Можно добавить фичи Фурье
Это такие фичи которые представляют собой функции синуса косинуса на графике, можно добавлять их для разной переодичности, если что-то происходит 2 раза в год, то будет 2 полных круга на графике, если 4, то 4 и тд. Далее линейная регресия разберется с этой фичей и построит предсказания

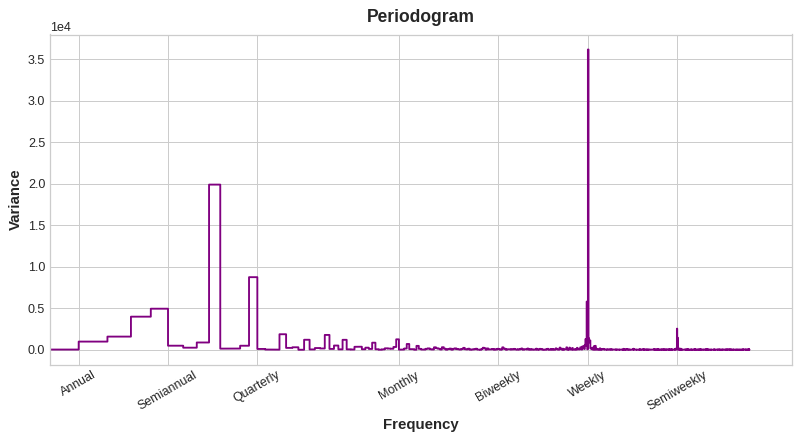
Периодограм показывает как много вариативности в наших данных и помогает выбрать правильное количество фич фурье

Полный код
from pathlib import Path
from warnings import simplefilter

import matplotlib.pyplot as plt
import pandas as pd
import seaborn as sns
from sklearn.linear_model import LinearRegression
from statsmodels.tsa.deterministic import CalendarFourier, DeterministicProcess

simplefilter("ignore")

# Set Matplotlib defaults
plt.style.use("seaborn-whitegrid")
plt.rc("figure", autolayout=True, figsize=(11, 5))
plt.rc(
    "axes",
    labelweight="bold",
    labelsize="large",
    titleweight="bold",
    titlesize=16,
    titlepad=10,
)
plot_params = dict(
    color="0.75",
    style=".-",
    markeredgecolor="0.25",
    markerfacecolor="0.25",
    legend=False,
)
%config InlineBackend.figure_format = 'retina'


# annotations: https://stackoverflow.com/a/49238256/5769929
def seasonal_plot(X, y, period, freq, ax=None):
    if ax is None:
        _, ax = plt.subplots()
    palette = sns.color_palette("husl", n_colors=X[period].nunique(),)
    ax = sns.lineplot(
        x=freq,
        y=y,
        hue=period,
        data=X,
        ci=False,
        ax=ax,
        palette=palette,
        legend=False,
    )
    ax.set_title(f"Seasonal Plot ({period}/{freq})")
    for line, name in zip(ax.lines, X[period].unique()):
        y_ = line.get_ydata()[-1]
        ax.annotate(
            name,
            xy=(1, y_),
            xytext=(6, 0),
            color=line.get_color(),
            xycoords=ax.get_yaxis_transform(),
            textcoords="offset points",
            size=14,
            va="center",
        )
    return ax


def plot_periodogram(ts, detrend='linear', ax=None):
    from scipy.signal import periodogram
    fs = pd.Timedelta("365D") / pd.Timedelta("1D")
    freqencies, spectrum = periodogram(
        ts,
        fs=fs,
        detrend=detrend,
        window="boxcar",
        scaling='spectrum',
    )
    if ax is None:
        _, ax = plt.subplots()
    ax.step(freqencies, spectrum, color="purple")
    ax.set_xscale("log")
    ax.set_xticks([1, 2, 4, 6, 12, 26, 52, 104])
    ax.set_xticklabels(
        [
            "Annual (1)",
            "Semiannual (2)",
            "Quarterly (4)",
            "Bimonthly (6)",
            "Monthly (12)",
            "Biweekly (26)",
            "Weekly (52)",
            "Semiweekly (104)",
        ],
        rotation=30,
    )
    ax.ticklabel_format(axis="y", style="sci", scilimits=(0, 0))
    ax.set_ylabel("Variance")
    ax.set_title("Periodogram")
    return ax


data_dir = Path("../input/ts-course-data")
tunnel = pd.read_csv(data_dir / "tunnel.csv", parse_dates=["Day"])
tunnel = tunnel.set_index("Day").to_period("D")
X = tunnel.copy()

# days within a week
X["day"] = X.index.dayofweek  # the x-axis (freq)
X["week"] = X.index.week  # the seasonal period (period)

# days within a year
X["dayofyear"] = X.index.dayofyear
X["year"] = X.index.year
fig, (ax0, ax1) = plt.subplots(2, 1, figsize=(11, 6))
seasonal_plot(X, y="NumVehicles", period="week", freq="day", ax=ax0)
seasonal_plot(X, y="NumVehicles", period="year", freq="dayofyear", ax=ax1);
plot_periodogram(tunnel.NumVehicles)
Создание фич
from statsmodels.tsa.deterministic import CalendarFourier, DeterministicProcess

fourier = CalendarFourier(freq="A", order=10)  # 10 sin/cos pairs for "A"nnual seasonality

dp = DeterministicProcess(
    index=tunnel.index,
    constant=True,               # dummy feature for bias (y-intercept)
    order=1,                     # trend (order 1 means linear)
    seasonal=True,               # weekly seasonality (indicators)
    additional_terms=[fourier],  # annual seasonality (fourier)
    drop=True,                   # drop terms to avoid collinearity
)

X = dp.in_sample()  # create features for dates in tunnel.index
Обучение модели
model = LinearRegression().fit(X, y)
y_pred = pd.Series(
    model.predict(X),
    index=X.index,
    name='Fitted',
)

y_pred = pd.Series(model.predict(X), index=X.index)
ax = y.plot(**plot_params, alpha=0.5, title="Average Sales", ylabel="items sold")
ax = y_pred.plot(ax=ax, label="Seasonal")
ax.legend();